
The 6-Figure Google Tech Stack to Master in 2026
Google’s ecosystem is free (mostly), scalable, and everywhere, but most people only ever scratch the surface.
They set up GA4, fumble through a few tags in GTM, maybe open Looker Studio once… and call it a day.
But under the hood, there’s a whole infrastructure waiting to be used, one that powers everything from clean reporting to ad performance to real business decisions.
This post isn’t a feature list or a promotion of Google’s products. It’s a practical breakdown of the Google tech stack that digital analysts actually use in the real world, the same stack that’s behind most six-figure analytics projects and roles.
By the end, you’ll have a clearer sense of what each tool does, how they connect, and what you should focus on learning next.
And if you run a business? You’ll walk away knowing what your current setup might be missing, and what kind of person you probably need to hire to fix it.
Anyway, let’s kick things off with…
Google Analytics
Google Analytics is still where most analysts start, and for good reason. Until recently, most teams used Universal Analytics (UA), the older version that some of you may be familiar with.
That changed on July 1, 2024, when Google officially shut down UA. Now, GA4 is the standard, and it’s what everyone uses when they talk about Google Analytics today.
We won’t dive too deep into the difference between GA4 and UA because that’s a topic for another post - but what matters right now is this:
GA4 is built to be more flexible, but that also means it requires more intention.
It won’t magically track what matters to your business. You have to define it, things like purchases, signups, button clicks, or whatever else matters to your product or client.
And in 2026, GA4 isn’t just a tool for checking traffic. It powers your remarketing audiences, connects with ad platforms, and feeds raw data into tools like BigQuery.
In most modern analytics setups, it’s the first stop, and the foundation for everything that comes next.
What to understand
You don’t have to memorize every functionality GA4 has to offer right off the bat. But there are a few core concepts that digital analysts must understand:
Event structure: GA4 tracks some basics like pageviews and sessions by default. But it doesn’t come with predefined goals or categories like UA did. You decide what to track beyond that, how to name it, and which parameters matter. That gives you more flexibility, and more control if you use it well.
Standard reports vs. Explorations: The default reports (under “Reports” in the UI) are great for quick checks, but they’re limited. The real power is in Explorations where you can build funnels, segment users, compare behaviors over time, and dig deeper into what's actually happening.
Custom dimensions and definitions: These let you capture data that GA4 doesn’t track by default, like user plans, page categories, or form types. Defining the right ones early on ensures your data aligns with business questions.
Attribution settings: GA4 lets you control attribution windows and models. Whether you're analyzing conversions or syncing data with Google Ads, understanding attribution is key to giving credit where it’s due.
There’s a lot more that Google Analytics offers, but we don’t want to overwhelm you guys, so we’ll stop here for now.
Google Tag Manager
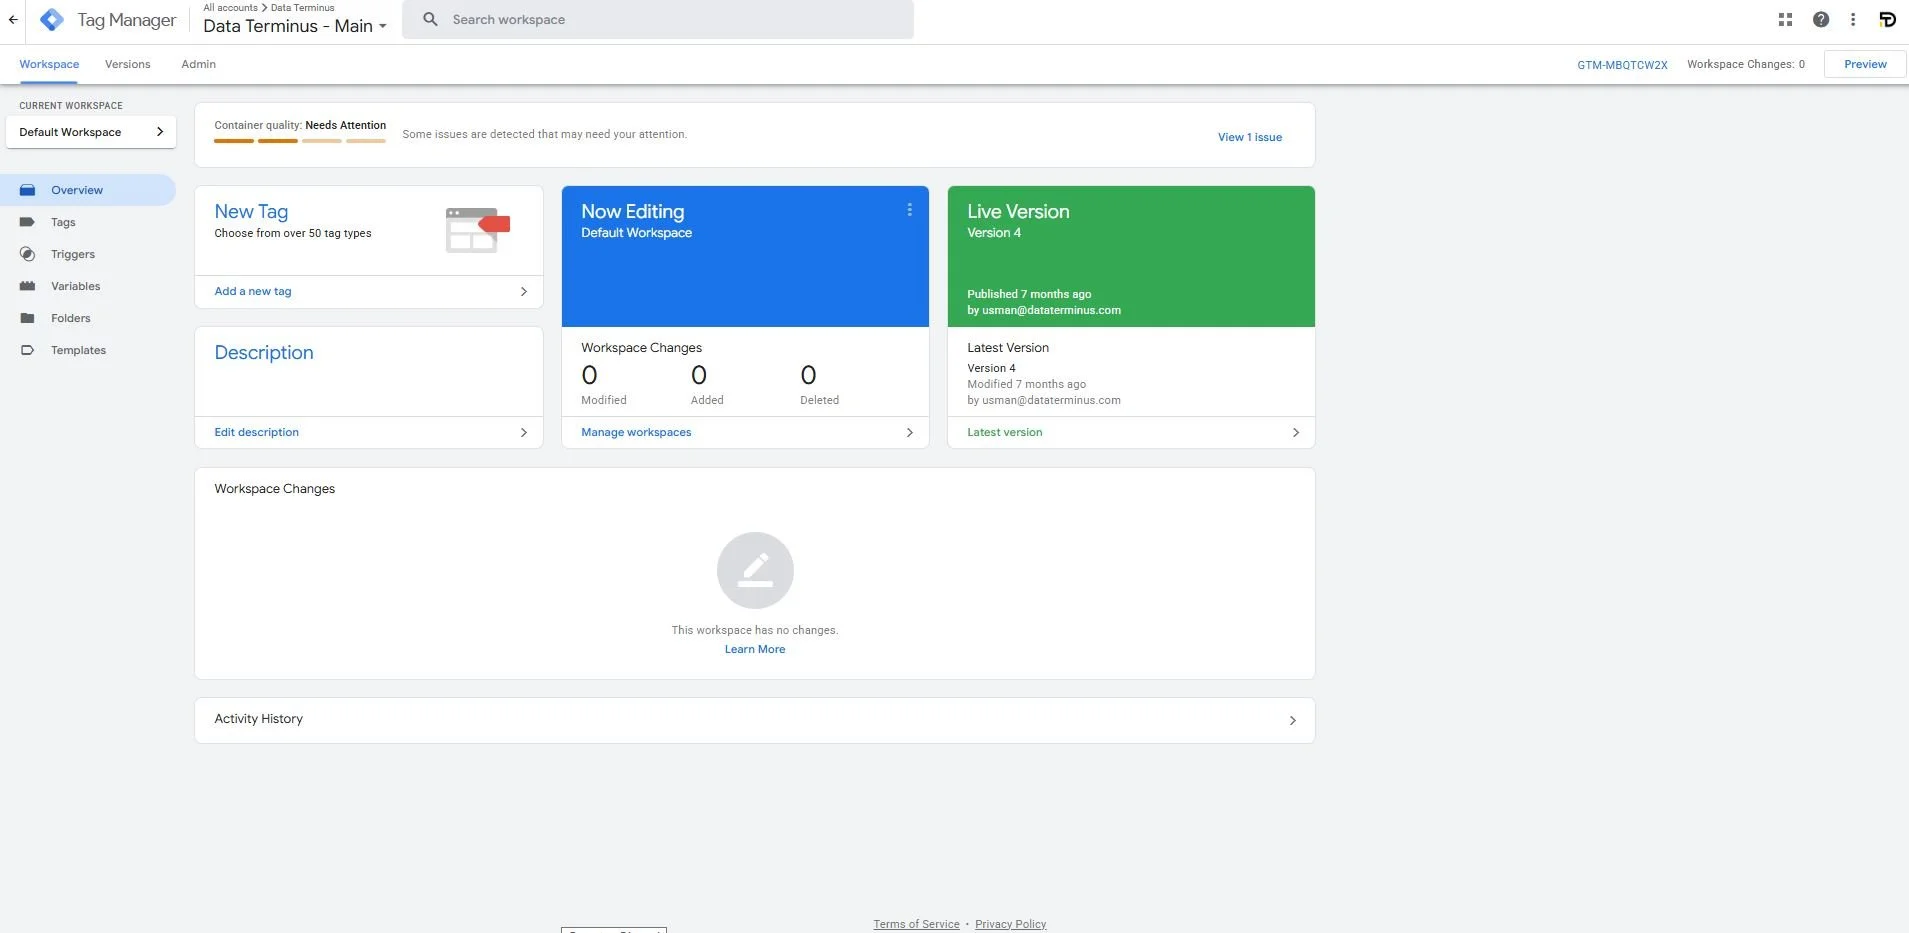
If GA4 is where your data gets analyzed, Google Tag Manager (GTM) is where it all begins. Unless…you’re committing one of the unspoken sins: tracking everything directly in GA4. Which you could, but probably shouldn’t. It’s clunky, limited, and nowhere near as flexible.
GTM lets you deploy and manage all your tracking, like GA4 events, Google Ads conversions, or pixels from other platforms, without needing to touch the site’s code every time. Instead, you drop in one GTM script and then control everything else from a clean, visual interface.
That means no waiting on developers, no hard-coding updates, and far fewer tracking mistakes.
For digital analysts, GTM is more than just a convenience. It’s a core skill, the thing that makes you operationally independent. You can launch new tags, fix broken tracking, or test changes without a dev sprint.
It also becomes essential when you start working across multiple tools, GTM is the hub where data is sent out to GA4, Google Ads, Meta, and beyond, unless you’re using a Customer Data Platform like Segment.
What to understand
You don’t need to become a GTM power user overnight, but you should get familiar with the core building blocks:
Tags: The actual scripts that send data, for example, a GA4 Event Tag for tracking a form submission.
Triggers: The conditions for when a tag should fire, like “when someone clicks this button” or when a page with “/thank-you” loads.
Variables: Extra bits of info you can pass along with your tags, like the page URL, button text, or a user’s selected plan.
On top of that, GTM gives you access to more advanced capabilities like Custom JavaScript, dataLayer pushes, and even consent management integrations, but don’t worry about all that just yet. You’ll grow into it.
What matters early on is learning how tags, triggers, and variables work together, and getting comfortable testing everything with Preview mode before you publish.
How it fits in the stack
GTM is the delivery system for all your tracking. It’s how you send clean, consistent data into GA4 and other platforms without bloating your site with a dozen scripts.
Here’s how it fits:
Want to track a new button click? You set up the trigger and tag in GTM.
Need to send a purchase conversion to both GA4 and Google Ads? GTM handles both in one place.
Running multiple client sites? GTM keeps things modular, scalable, and (mostly) developer-free once the dataLayer is pushed to the website.
As you grow, you’ll likely also hear about server-side GTM, a more advanced setup that routes data through your own cloud server. We’ll touch on that later in this guide as well, but for now, just know that GTM is the tool that gives you full control over what gets tracked, when, and where it goes.
Google BigQuery
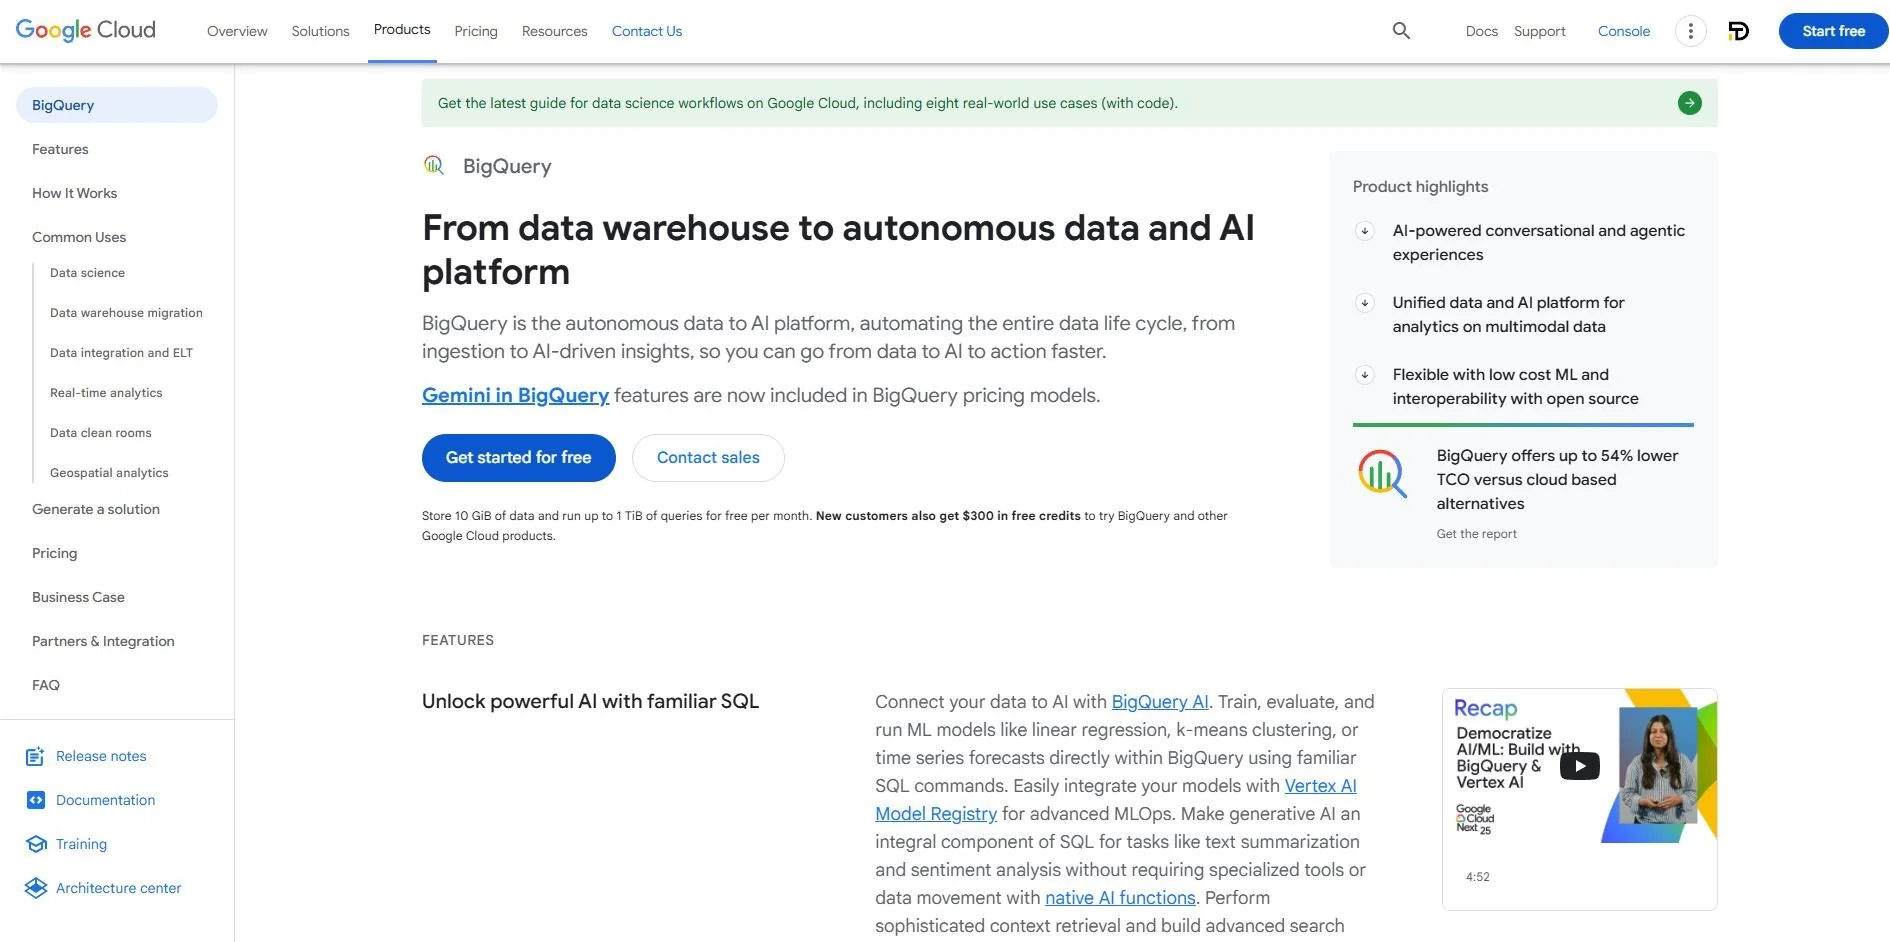
GA4 is great for quick insights, but it has limits. Sampling, retention caps, and missing granularity can get in the way when you want to answer bigger questions. That’s where BigQuery comes in.
BigQuery is Google’s cloud data warehouse. It stores your raw GA4 data, every single event, every user interaction, unsampled and in full detail. And because it's built to handle massive datasets, it’s lightning-fast even when you're querying millions of rows.
In plain terms: BigQuery lets you dig deeper. You can analyze trends across months or years, build custom metrics, join marketing data with backend data, and do it all using SQL.
It’s not just for analysts at big enterprises anymore. In 2026, even smaller teams use BigQuery to unlock the kind of insights GA4 alone can’t provide.
What to understand
You don’t need to be a data engineer to get started with BigQuery, but you should know what makes it valuable and how to use it effectively.
Raw, unsampled data: When you link GA4 to BigQuery, you get access to every event and parameter, exactly as it happened, no thresholds, no "(other)" rows, and no retention limits.
SQL-based analysis: BigQuery uses standard SQL for querying data. Even simple queries (like revenue by device or campaign over the last 90 days) give you more flexibility than the GA4 interface ever will.
Joining data: BigQuery lets you combine GA4 data with other sources like Google Ads spend and CRM data to build a more complete picture of performance.
If you’ve ever felt stuck in GA4 because you “can’t quite get the report you need,” BigQuery is the solution. It’s where you go when the questions get more advanced or when the stakes are higher.
How it fits in the stack
BigQuery is the backbone of deep analysis in the Google stack.
Here’s how it typically fits in:
GA4 sends raw event data into BigQuery automatically (once linked).
That data can then be queried, cleaned, and enriched, either by analysts or through automated scripts.
Tools like Looker Studio can connect directly to BigQuery, turning complex queries into simple dashboards.
You can also join BigQuery data with costs from Google Ads, metadata from your CMS, or revenue from your backend, making it the single source of truth.
It’s not a replacement for GA4, it’s the power-up. Analysts who understand how to use BigQuery alongside GA4 can answer questions faster, uncover patterns others miss, and bring real strategic value to the table.
You don’t need to master it overnight. But once you know it’s there, and what it unlocks, it’s hard to imagine working without it.
Looker Studio
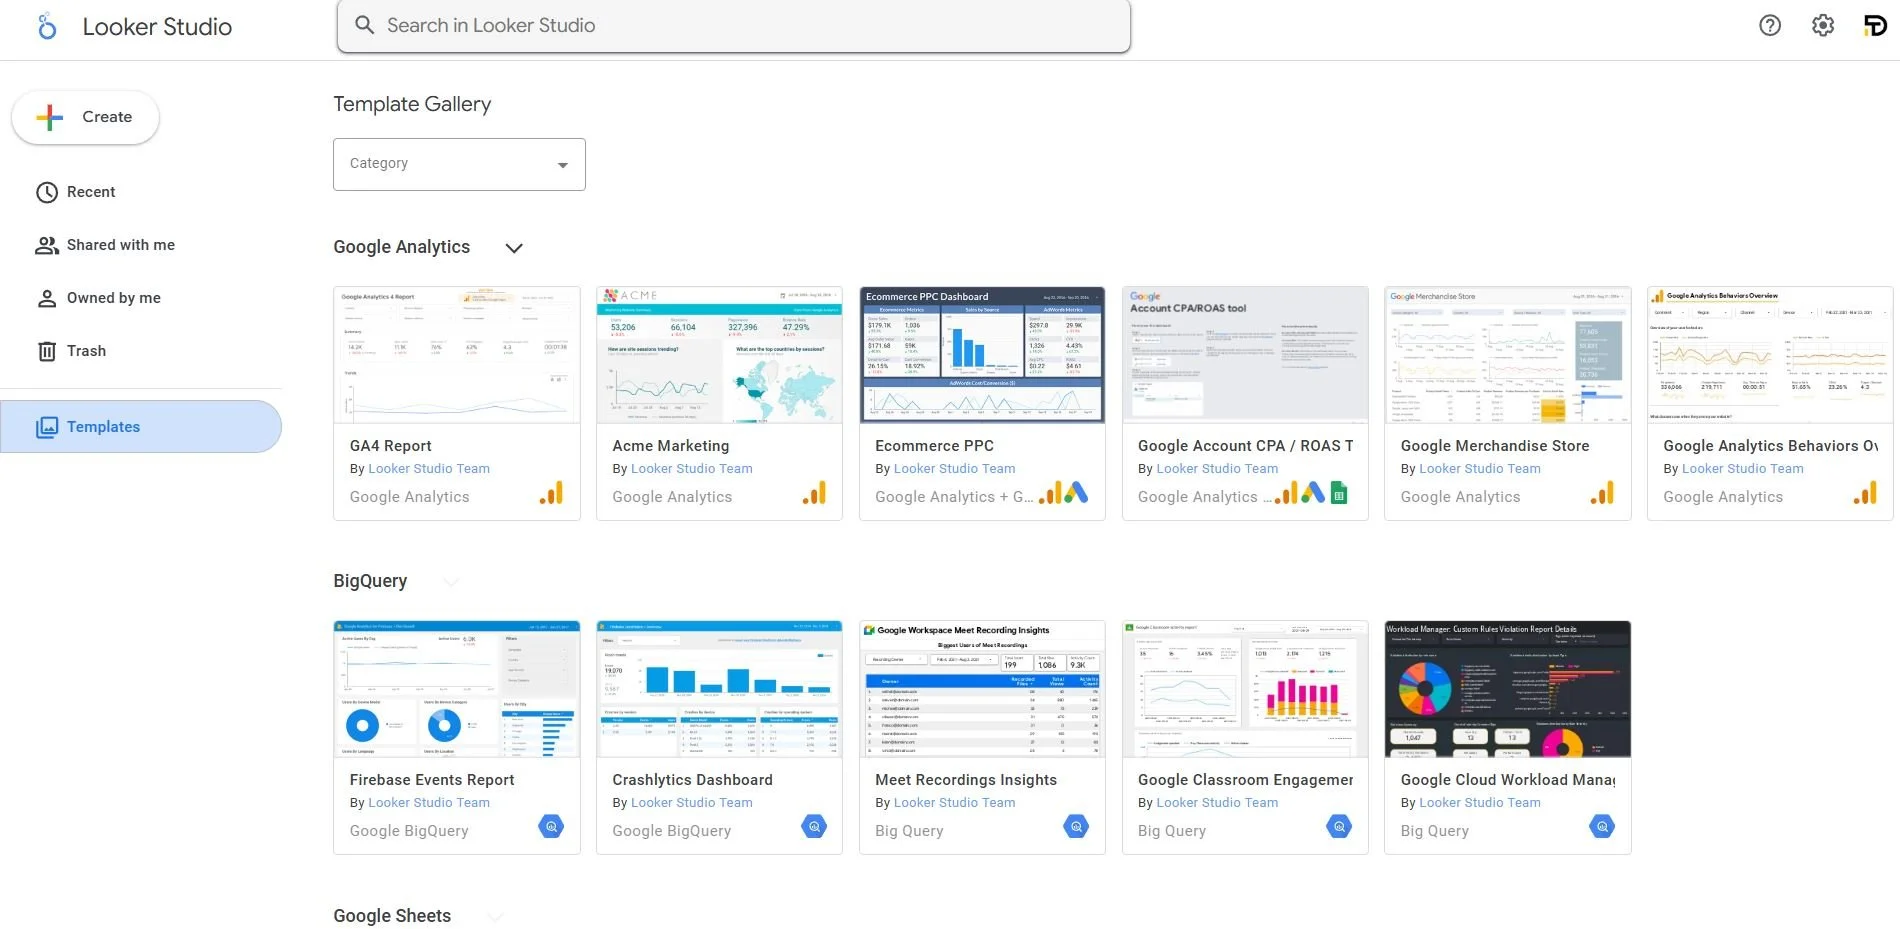
You’ve got the data. Now you need to make it useful.
Looker Studio (formerly Data Studio) is how you turn raw numbers into clear, visual reports that real people can understand and act on, whether that’s your team, your boss, or your client.
It’s free, flexible, and deeply integrated with the Google ecosystem. You can plug in GA4, BigQuery, Google Ads, and more, and create dashboards that update automatically. No spreadsheets, no manual screenshots, no weekly copy-paste rituals.
Today, Looker Studio is more than a reporting tool; it’s how you communicate what matters.
What to understand
You don’t need to be a designer or BI expert to get started. Looker Studio is built for marketers, analysts, and teams that want to see the story behind the data.
Here are a few basics to know:
Connectors: You can pull data from GA4, BigQuery, Google Ads, Sheets, and more. The setup is usually a few clicks, no code required.
Charts and filters: You build dashboards using time series, tables, bar charts, filters, date pickers, all the essentials for making data interactive.
Calculated fields: You can create new metrics on the fly, like conversion rate, ROAS, or custom goals, without needing to touch the source data.
Sharing and access: Just like a Google Doc, you can share dashboards with view or edit access, or embed them on a site.
The goal isn’t to make things flashy, it’s to make them clear. If someone can open your dashboard and immediately understand what’s working (and what’s not), you’ve done your job.
How it fits in the stack
Looker Studio is the front-end of your analytics stack. It sits on top of GA4, BigQuery, and also pulls data from other “data sources,” bringing it into one place.
Here’s how it works in context:
GA4 tracks the data.
BigQuery stores and processes the raw events.
Looker Studio tells the story, showing key trends, comparisons, and performance metrics in a way that anyone on the team can use.
For client work, Looker Studio is often the deliverable. It’s the thing the client opens before a meeting, the thing that gets bookmarked, shared, and trusted.
When used well, Looker becomes more than a dashboard, it becomes the interface between data and decision-making.
Server-Side Tagging - Powered by GCP or Stape
As tracking gets harder, due to ad blockers, browser restrictions, and privacy laws, client-side tagging (what most of us do in GTM) is starting to hit limits.
That’s where server-side tagging comes in. Instead of sending data directly from the browser to GA4 or Google Ads, you route it through a server that you control.
This gives you cleaner data, better control, and more flexibility in how you handle and forward events.
Server-side tagging isn’t just for big enterprises. More and more teams, especially those managing paid media at scale, are implementing it to improve data quality and future-proof their stack.
What to understand
There are two common ways to host your server-side GTM setup:
Google Cloud Platform (GCP) – The official route, where you deploy your GTM server container to App Engine or Cloud Run inside a GCP project.
Stape – A popular managed service that simplifies the process and hosts the server for you.
Both options do the same thing: they act as a middle layer between your site and your marketing platforms. But they differ in cost, setup, and flexibility.
Here’s a quick breakdown:
| Hosting Option | Pros | Cons |
|---|---|---|
| GCP | Full control, direct integration with the Google ecosystem, scalable | More technical setup, requires monitoring, variable monthly costs |
| Stape | Easy setup, beginner-friendly, fixed pricing plans | Less flexible, limited debugging/customization for advanced users |
Note: If you're just starting out, Stape is often the easiest way to test server-side GTM without learning cloud infrastructure. But if you're working across multiple sites, want more customization, or need tighter integration with BigQuery/GCP projects, hosting on GCP is worth the learning curve.
How it fits in the stack
Server-side GTM is still GTM, just running in a different environment.
Here’s how it connects with the rest of your stack:
Client-side GTM collects data and forwards it to your server container (hosted on GCP or Stape).
The server container client receives the hit, processes or enriches it, and then forwards it to GA4, Google Ads, Meta, or wherever else it needs to go, depending on your tags.
Because the request comes from your server (not the user’s browser), it’s harder to block, uses first-party cookies, and can be privacy-compliant by design.
In short: server-side tagging gives you more control over your data and more reliability in getting it where it needs to go.
How It All Ties Up
The real power of this stack isn’t in any one tool, it’s in how they work together.
You track the right things in GA4. You control how that data flows with GTM. You explore it in BigQuery. You present it in Looker Studio. And as your setup matures, server-side tagging helps keep things clean, stable, and future-proof.
That’s not just a workflow, it’s a mindset. And in 2026, it’s what separates analysts who build dashboards… from analysts who build infrastructure.
If you’ve made it this far and thought, “Wow, this is a lot,” - you’re not wrong. It is!
But you don’t have to figure it all out alone.
At Data Terminus, this is the kind of stack we live and breathe. Whether you need help setting things up, fixing what’s already broken, or just someone to nod politely while you rant about (not set) in your GA4 reports, we’re here for it.
No false promises or vague roadmaps. Just clean, useful data setups that don’t fall apart the moment a new update rolls out.